Mastering GTmetrix: the essential tool for optimising your website

A poorly optimised website makes browsing slow and frustrating for your visitors. This affects your retention rate, your server performance and even your website's search engine ranking. Fortunately, there is an excellent tool to guide you through optimising your websites: GTmetrix. Let's take a closer look.
GTmetrix, a measurement tool
Before optimising a website, you first need to be able to measure its performance accurately. These measurements should be repeated throughout the optimisation process to check how effective each improvement is.
The website https://gtmetrix.com/ is the perfect tool for the job. It measures website performance from the visitor's point of view and gives you precise information about what can be optimised.
We recommend creating a free account: it lets you set preferences (test server location and test browser), find your previous results and, above all, gives you priority in the test queues, saving you precious minutes during the many tests needed to optimise a website properly.
Note: as a general rule, check the performance of your most visited pages first. The first test is therefore usually run on the home page, the anchor point of most websites.
Running your first GTmetrix test
Go to the website's home page, enter your website's URL and click "Analyze".
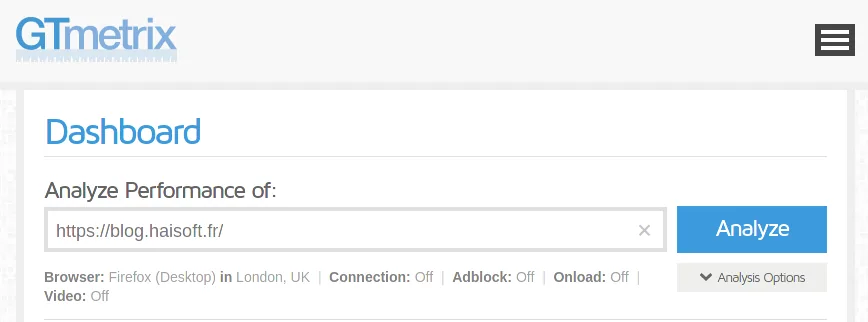
All you have to do now is wait a few moments for the result.
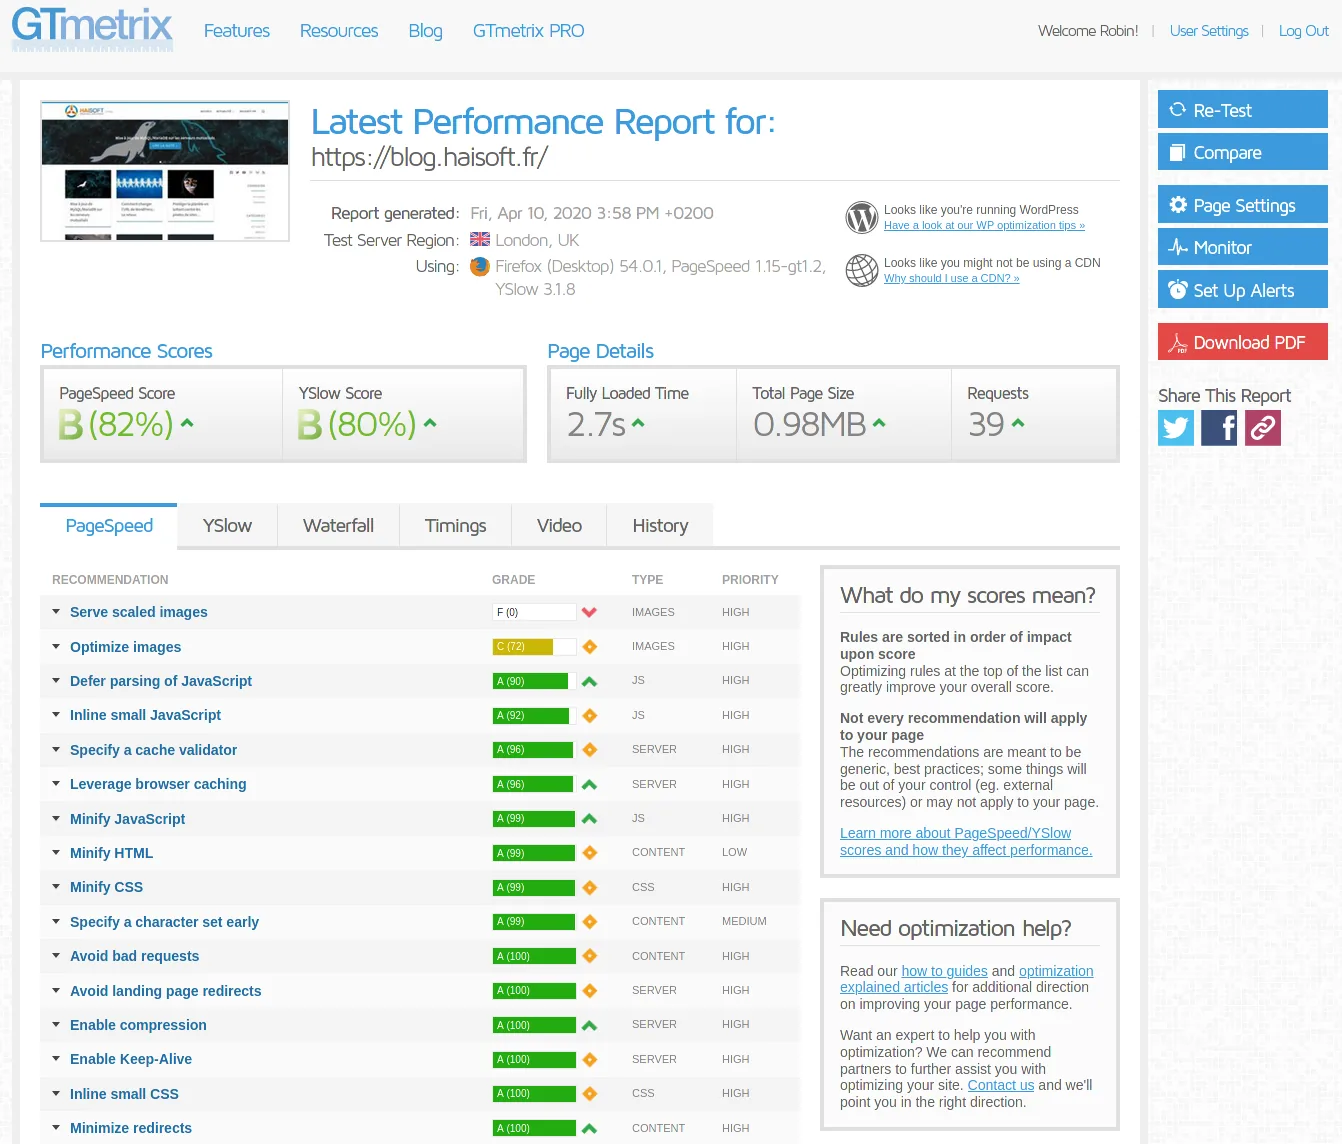
In this example, our WordPress website does not suffer from any serious optimisation issues. A "B" grade is generally acceptable. Nevertheless, we fully intend to achieve an "A", and we will show you how in a dedicated article. For now, we will focus on understanding GTmetrix, as this is absolutely essential to optimising your website effectively.
A first look at GTmetrix
GTmetrix is extremely well designed and gives you an accurate picture of how well the tested website is optimised at a glance. Let's go through the different parts of this overview.

Performance Scores
These scores combine the results of many tests, which we will look at in detail below.
- The PageSpeed Score is based on Google's tests. Its details are displayed on the default page. This test looks directly at the content your website sends to visitors, whether images or scripts, along with their meta information. The minimum recommended grade is "B". Below that, you should take a serious look at your website's optimisation. This score is crucial: since it was created by Google, it is likely to affect your search ranking, which is fundamental for any online business.
- The YSlow Score covers more technical optimisations, such as the number of requests made, the headers of the files sent (that is, the meta information the web server sends about the files), bad practices in the scripts used, and so on. As with the PageSpeed Score, the minimum recommended grade is "B". Below that, you should take a serious look at your website's optimisation.
Page Details
- Fully Loaded Time shows how long the GTmetrix server took to load the page completely. Choose the GTmetrix server closest to your visitors to get a value that better reflects what they will experience. To do this, you need to create a free GTmetrix account. Ideally, the page should load in under 3s. Bear in mind that the GTmetrix server may load your page more slowly than a real visitor with an excellent connection close to your server would, but on average your visitors will have a connection fairly similar to that of GTmetrix. With a WordPress website featuring every optimisation imaginable, the best result we have measured is around 0.9s. Note that many factors can affect this result, including WordPress crons (scheduled tasks that run once a minute), server load and so on. Don't hesitate to run 2 or 3 tests in a row for a more reliable value. Finally, remember that this time is the sum of the time the server needs to generate the page (which depends on how well the scripts on your website are optimised) and the time taken to send the files. To find out which to work on, look in particular at the "TTFB" (time to first byte), which we discuss at the end of this article.
- Total Page Size is the size of your page in KB or MB. We recommend staying under 1MB for most websites and allowing a maximum of 2MB for more graphic websites. Even ignoring all the other delays that occur before the website's files are sent to the visitor, 2MB on an 8Mbit/s ADSL connection already means 2 seconds of loading time, at best. 2 seconds per page can already be a lot if browsing your website requires many clicks. Photography and other multimedia websites may be an exception and use the weight needed for high-quality display; even so, it is better to use images that are enlarged only when needed.
- Requests shows the number of requests, or files, needed to display the website. This factor can have a very significant impact on your website's speed. Ideally, this value should be under 20 requests, with a tolerated maximum of 40. Beyond 50 requests, your website may start to slow down noticeably, especially on slower internet connections. From 200 requests upwards, you will generally lose several long seconds (5 to 10s) of loading time depending on where your files come from, since some resources may be loaded from sources other than your website, such as scripts, fonts or stylesheets, which should ideally be avoided.
PageSpeed and YSlow tests in detail
Here we will cover the most common optimisation issues. This will give you a solid foundation for understanding the main optimisation problems websites face. However, this list is not exhaustive: if your issue relates to a different test, GTmetrix provides brief explanations of each test when you expand the corresponding line. You will also find resources fairly easily (often forums) describing the rarer errors you may come across.
PageSpeed in detail
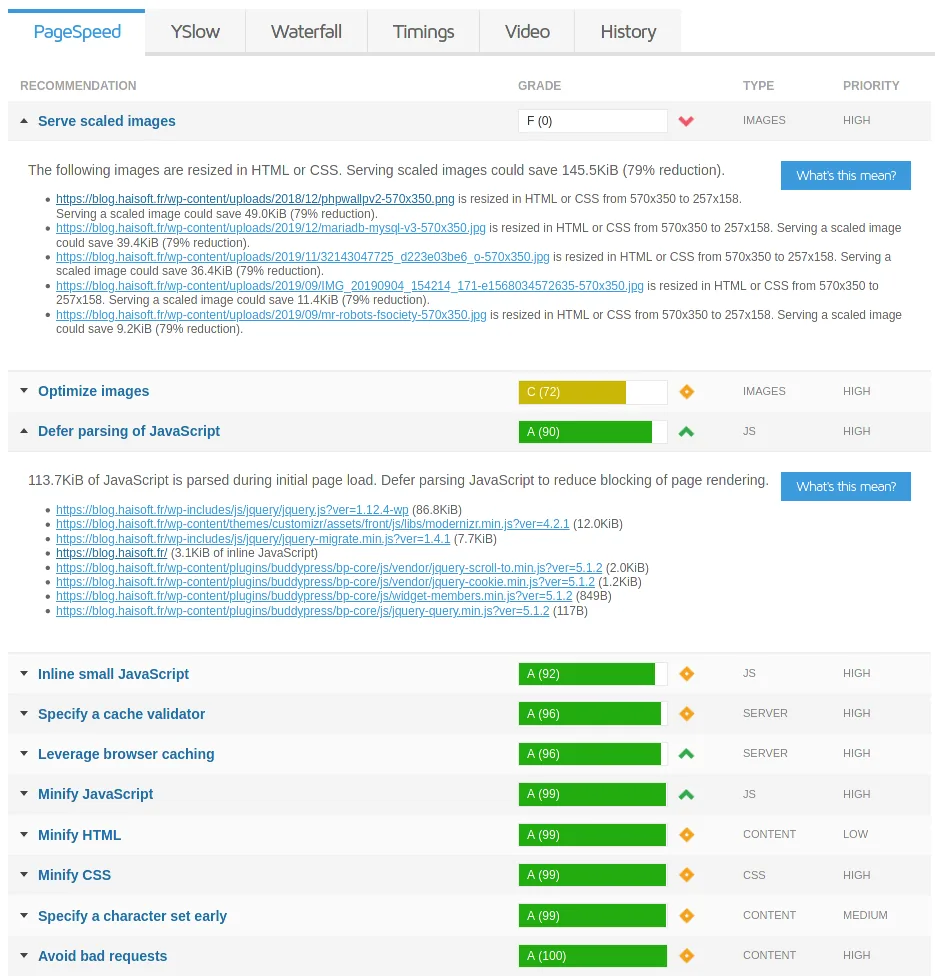
Here are the issues that come up most often and how to fix them.
- Serve scaled images: this means you are sending images that are larger than the size at which they are displayed. You will need to resize the images on your website or generate thumbnails in different sizes so that they are served at the right scale, whatever the size of the visitor's screen.
- Optimize images: this means the image compression is not strong enough for PageSpeed's liking.
- Defer parsing of JavaScript: this means JS scripts are blocking the display of the website while they load, so they need to be loaded last. This optimisation issue usually comes from the template, theme or page builder used. Some CMSs or scripts are also very heavy and poorly optimised, so choose scripts (CMS, themes, builders) that are properly optimised in this respect. This issue can sometimes be worked around with certain caching plugins (such as W3 Total Cache for WordPress).
- Leverage browser caching: this appears when files are loaded without the server specifying an expiry time (Apache's well-known Expires headers). The recommended value is 15 days. This can be set in the website's .htaccess file. On a virtual or dedicated server, Plesk also lets you change the default value under "Apache & nginx Settings" then "Expires", where you set a custom value of 15 days. On shared hosting, you can ask HaiSoft support to increase this value by opening a support ticket. For WordPress, some caching plugins can also take care of this. Be careful: there is a limit. If your website (or theme/builder) uses external resources, you have no control over the Expires headers of those files (Google Fonts, for example, will trigger this error), and this alone can sometimes lower your GTmetrix score significantly. In that case, choose a theme that is well optimised in this respect and avoids external resources as far as possible.
- Minify JavaScript/CSS/HTML: this means compressing script files. If they are not compressed out of the box, use a caching plugin that offers this option.
YSlow in detail
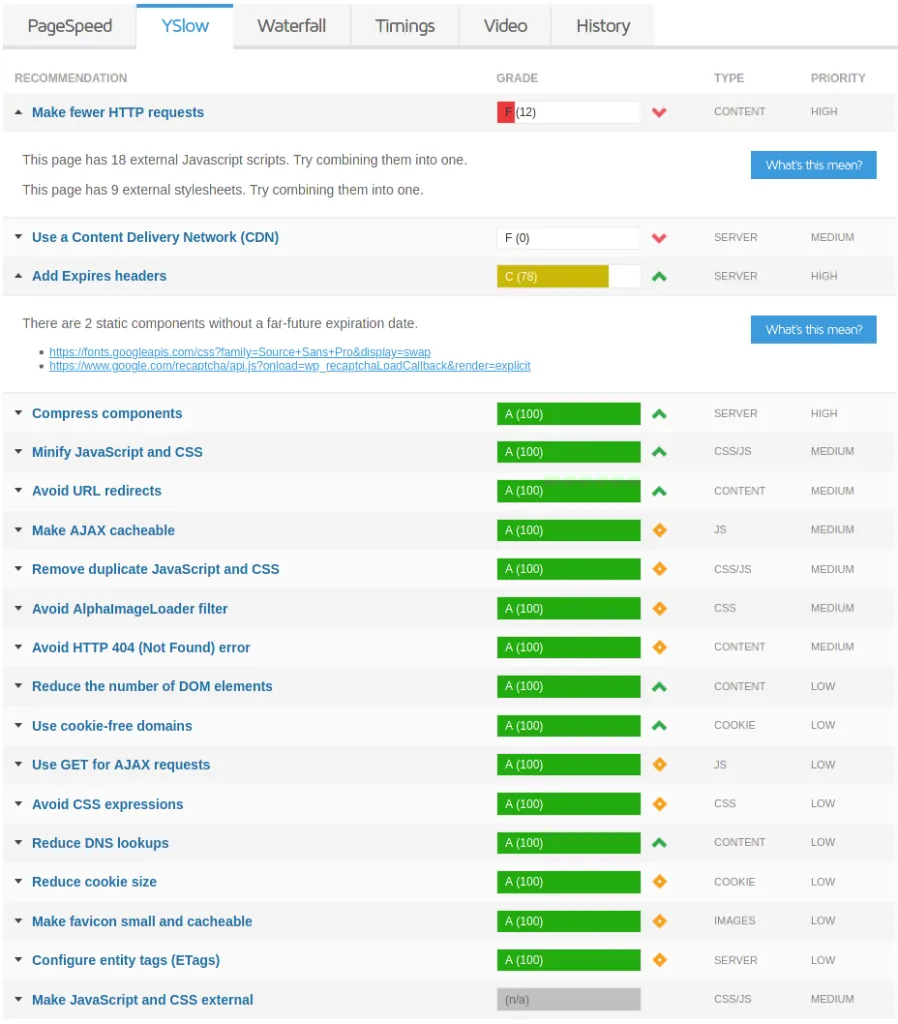
This test is generally easier to understand. Here are most of the messages you will come across:
- Add Expire headers: this is similar to PageSpeed's Leverage browser caching.
- Make fewer HTTP requests: this happens when your website calls too many resources. It may be due to the number of images, but more often comes from the theme or page builder used. A native theme is therefore preferable to a page builder, and it should be chosen carefully to make sure it does not pull in resources from too many places.
- Use a Content Delivery Network (CDN): here you are advised to use a CDN such as Cloudflare. This takes load off the server and delivers your files faster when visitors are far from the server (more than 2,000 km). It is worth considering especially for very high-traffic websites. HaiSoft can set up and manage your CDN if needed.
- Reduce the number of DOM elements: this indicates that there are too many elements on your page, which can slow down the browser's rendering as it interprets the scripts that apply to the page.
Waterfall
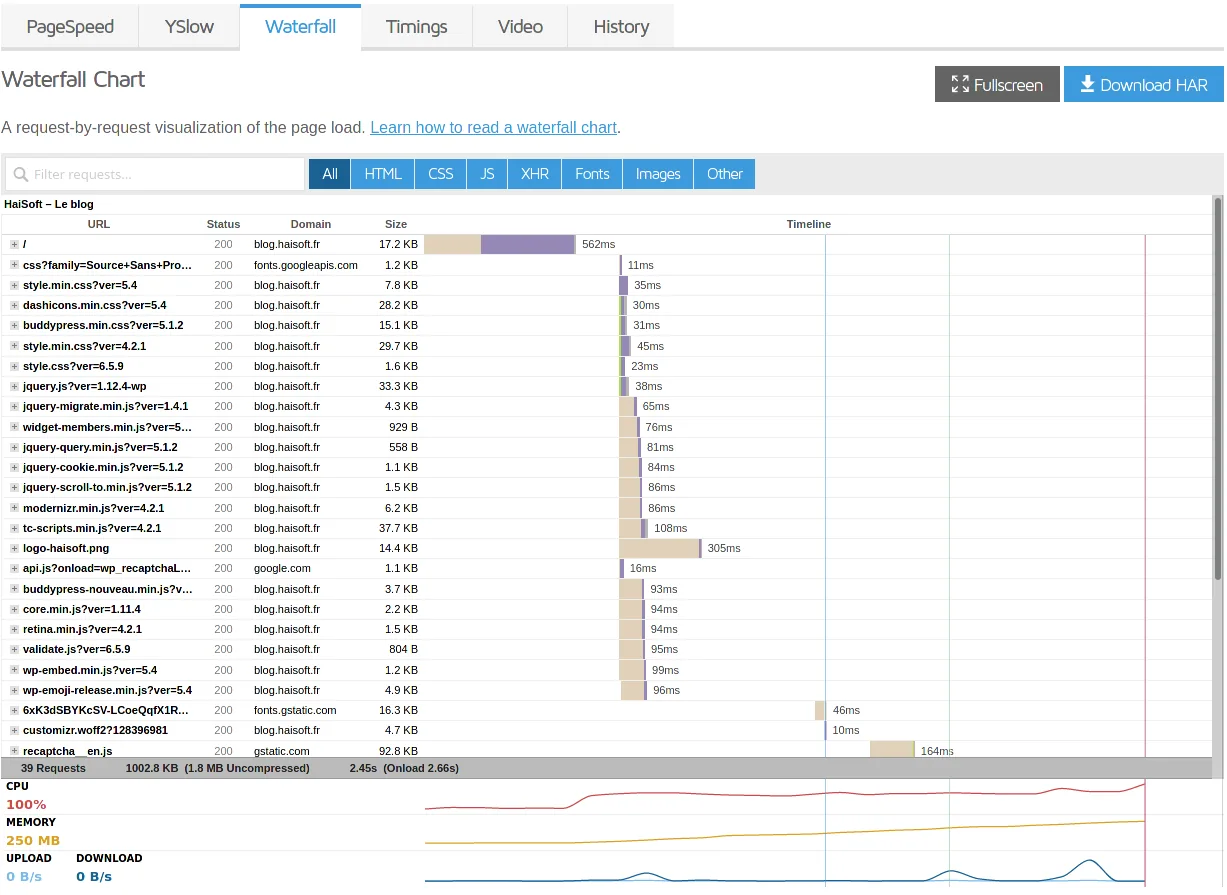
The "Waterfall" view shows the loading time of every file, as well as the resources used by the browser loading the page. It lets you see the impact of the files and scripts on the server and potentially identify the least optimised scripts so you can rework or replace them.
Timings
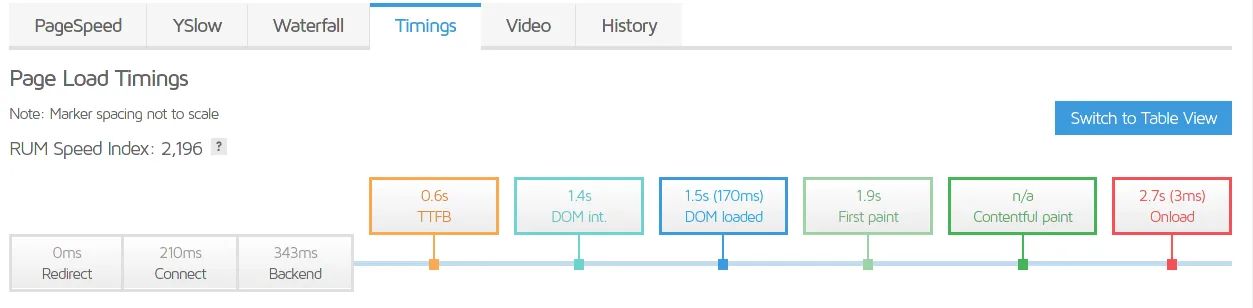
Finally, the timings show the different stages of page loading.
- TTFB, or "Time To First Byte", is the time the server takes to send the first response to the client's page request. It indirectly reflects how long the server takes to generate the page. This time depends on the server's performance. When server performance is top-notch (as at HaiSoft!), it depends mainly on how well your website is optimised: the quality and number of scripts used, compatibility with recent software versions, and so on. A dedicated or virtual server sized to your needs will deliver the lowest and most consistent TTFB possible. Note that for websites such as WordPress, which run a cron every minute, the TTFB can vary considerably if the GTmetrix test coincides with that cron.
- DOM int. shows the time needed for the page's HTML to be downloaded by the visitor.
- DOM loaded shows the time needed to process the HTML code that is not blocked by JS scripts and the like.
- First paint shows the moment when the page actually starts to appear in the visitor's browser.
- Onload shows the moment when the page and all its scripts have fully loaded and run.
A total of no more than 3s is recommended. Ideally, this value should be closer to 1 second.
Conclusion
We have seen that GTmetrix is a powerful and indispensable tool for diagnosing how well a website is optimised.
We have also seen that optimisation means reducing loading times for visitors as much as possible. This can be done on two main fronts: on the one hand, optimising the time the server takes to generate the website's pages (which means optimising scripts, avoiding piling up plugins and so on), and on the other hand, optimising the resources sent to visitors, that is, the various images, scripts and fonts.
This involves a number of sometimes counter-intuitive factors, such as the choice of your website's theme and the plugins installed, which in turn affects another important criterion: the number of files sent to visitors. File meta information, image sizing and compression and so on are all elements whose causes and implications are important to understand, and that is what this article is for.
While you can already work out ways to optimise your website from this, we don't intend to stop there: we will very soon guide you through the hands-on optimisation of your WordPress website using GTmetrix!
To make sure you don't miss the next instalment, follow us on social media!